
Accenture plc (NYSE: ACN) is a global leader in professional services, specializing in strategy, consulting, digital transformation, technology, and operations. With operations in over 120 countries, Accenture serves clients across industries, helping businesses embrace digital advancements and artificial intelligence (AI). The company has built a strong reputation for innovation and efficiency, positioning itself as a key player in the rapidly evolving technology landscape.

Company Financials
As of February 27, 2025, Accenture’s stock is trading at $360.21 per share, with a market capitalization of $225.50 billion. The company’s trailing twelve-month (TTM) revenue stands at $66.36 billion, while net income is reported at $7.57 billion. Earnings per share (EPS) are $11.93, with a price-to-earnings (P/E) ratio of 30.22, suggesting that investors have high expectations for future growth.
Other key financial metrics include:
- Forward P/E Ratio: 27.89
- Dividend per Share: $5.92 (Yield: 1.64%)
- 52-Week Range: $278.69 – $398.35
- Beta: 1.23 (indicating moderate volatility)
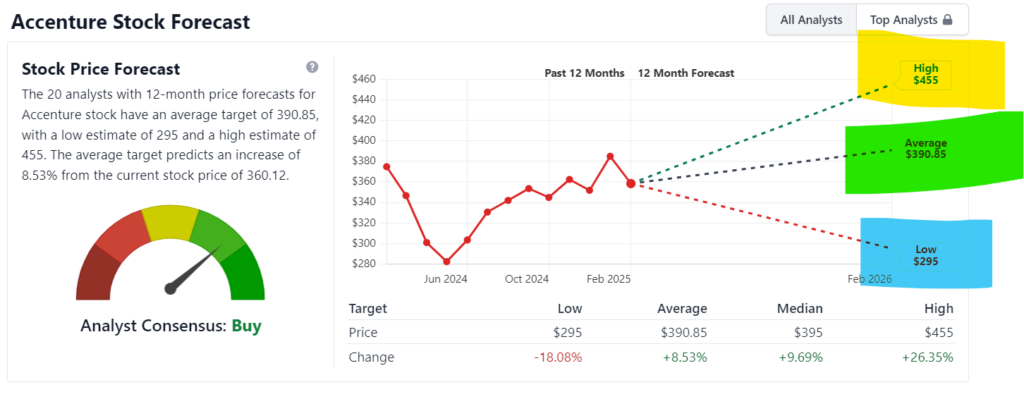
- Analyst Consensus: Buy (Price Target: $390.85, an 8.41% upside)
Stock Price Analysis & Prediction (2024-2030)
Short-Term Outlook (2024-2025)
Accenture has started 2025 on a positive note. The company recently reported fiscal Q1 2025 earnings of $3.59 per share on $17.69 billion in revenue, exceeding market expectations. Despite a slight downward revision in its full-year EPS guidance ($12.43-$12.79), Accenture raised its revenue growth forecast to 4%-7% for fiscal 2025.
Market analysts remain optimistic, with a 12-month price target of $390.85. Given Accenture’s strong fundamentals and continued investments in AI and cloud computing, its stock price is expected to reach $400 by the end of 2025.
Mid-Term Forecast (2026-2030)
Over the next five years, Accenture is expected to experience steady growth, driven by:
- Expanding AI and digital transformation services
- Strategic partnerships with tech giants like Nvidia
- Growing demand for cloud computing and cybersecurity solutions
Based on current projections, Accenture’s stock could:
- Reach $450 by the end of 2026
- Surpass $500 by 2027
- Continue its upward trajectory, reaching $600+ by 2030
Accenture’s ability to adapt to emerging technologies and scale its digital solutions will be the key drivers behind this projected growth.
Long-Term Outlook (2030-2050)
While precise forecasts beyond 2030 are uncertain, Accenture’s long-term potential remains strong. The company’s investments in AI, automation, and data analytics suggest that it will continue expanding at a steady pace.
By 2040-2050, Accenture’s role in shaping the future of AI-driven businesses could position it as a trillion-dollar company. With revenue expected to surpass $100 billion annually by the early 2030s, the stock could see exponential growth, making it a solid long-term investment
Balance Sheet Analysis
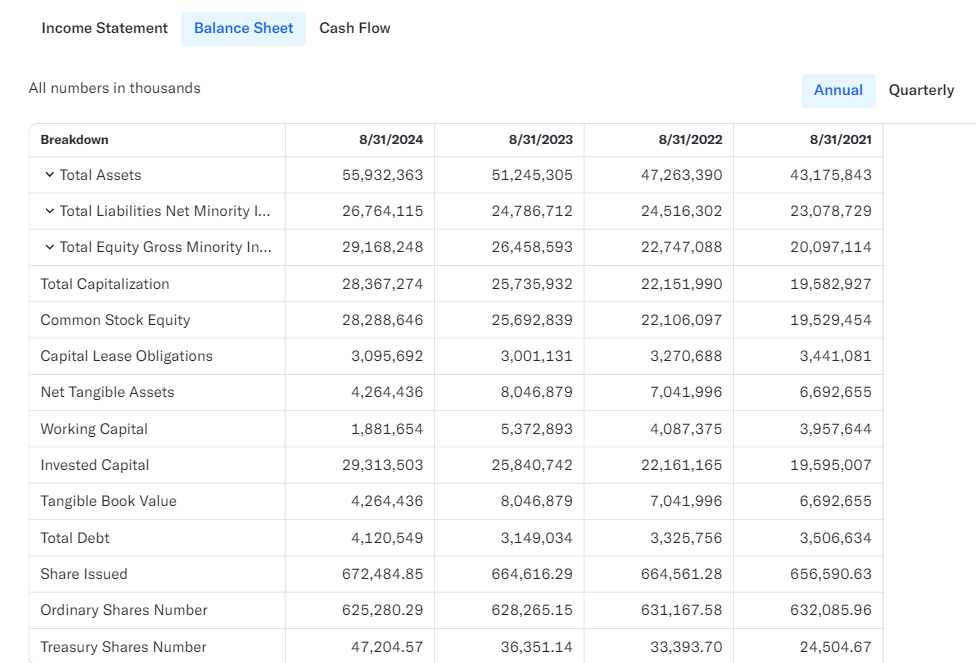
Accenture maintains a healthy financial position, backed by strong assets and minimal debt. Key balance sheet highlights:
- Total Assets: $59.87 billion
- Total Liabilities: $29.77 billion
- Cash & Equivalents: $8.31 billion
- Shareholders’ Equity: $30.10 billion
With low debt levels and consistent cash flow, Accenture has the flexibility to invest in growth initiatives while maintaining shareholder returns through dividends and stock buybacks.
Conclusion: Is Accenture a Good Investment?
Accenture has proven itself as a resilient, innovative, and financially sound company. With strong revenue growth, expanding AI capabilities, and a solid balance sheet, its stock presents a promising opportunity for both short-term traders and long-term investors.
- Short-Term (2025): Price target of $390-$400
- Mid-Term (2026-2030): Expected growth to $500-$600
- Long-Term (2030-2050): Potential to reach $1000+ as AI adoption increases
As with any investment, risks remain, including market volatility and global economic shifts. However, Accenture’s strong fundamentals and strategic positioning make it a compelling stock to watch in the coming years.
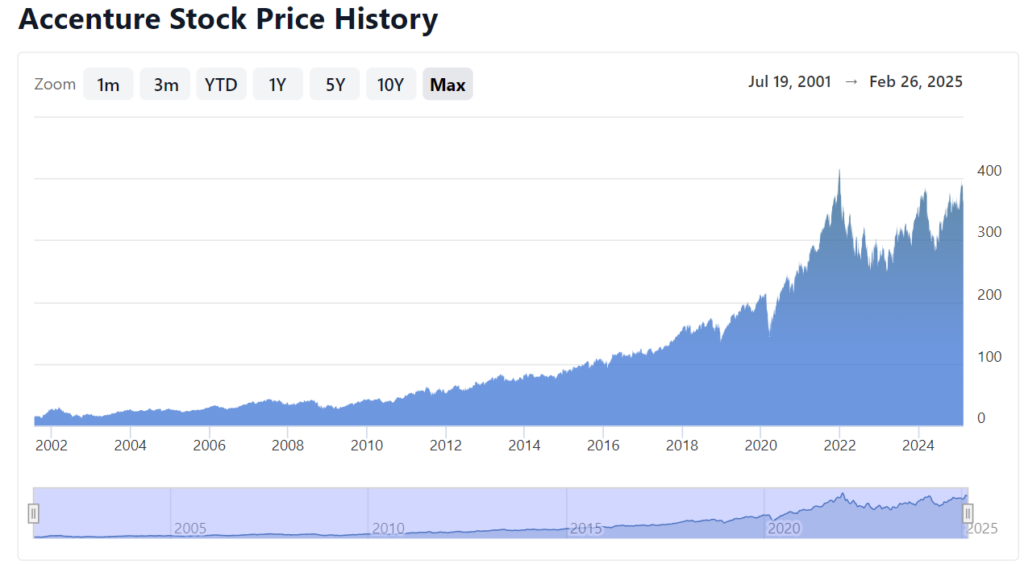
Market Cap History: A Decade of Growth
Market capitalization, or market cap, is a crucial indicator of a company’s size and value in the stock market. Accenture’s market cap has shown consistent growth over the past 10 years, proving its ability to weather market challenges and deliver shareholder value.
Accenture’s Market Cap History (2015-2025)
| Year | Market Cap (in Billion USD) | Annual Change (%) |
|---|---|---|
| 2015 | 68.02 | +16.2% |
| 2016 | 75.42 | +10.9% |
| 2017 | 97.45 | +29.2% |
| 2018 | 93.97 | -3.6% |
| 2019 | 133.91 | +42.5% |
| 2020 | 173.06 | +29.2% |
| 2021 | 261.99 | +51.4% |
| 2022 | 168.17 | -35.8% |
| 2023 | 220.01 | +30.8% |
| 2024 | 222.78 | +1.3% |
| 2025 | 224.14 (estimated) | +0.6% |
The numbers reveal strong long-term growth, with occasional dips during economic downturns. The 2022 dip was due to market volatility and rising interest rates, but Accenture rebounded quickly in 2023 and 2024.
Stock Price Predictions (2024-2030)
The big question for investors is: Where is Accenture’s stock price heading? Let’s break it down year by year.
Short-Term Forecast (2024-2025)
- Current stock price: $359.72 (as of Feb 27, 2025)
- 12-month price target: $390.85 (+8.72% upside)
- 2025 prediction: Analysts expect the stock to trade between $380-$400
Why?
Accenture’s strong Q1 2025 earnings, increased demand for digital transformation services, and expansion into AI-driven consulting make it a buy recommendation for 2025.
Mid-Term Forecast (2026-2030)
By 2026-2027, Accenture’s growth is expected to continue, fueled by:
✅ AI & Cloud Expansion: Accenture is investing heavily in AI and cloud computing, boosting revenue.
✅ Strategic Partnerships: Collaborations with Microsoft, AWS, and Nvidia enhance its competitive edge.
✅ Digital Transformation Demand: More companies are adopting AI, automation, and cybersecurity solutions.
📌 Stock Price Projections (Estimated)
| Year | Estimated Stock Price |
|---|---|
| 2026 | $450-$470 |
| 2027 | $500-$520 |
| 2028 | $550-$580 |
| 2029 | $600-$630 |
| 2030 | $650-$700 |
If these trends continue, Accenture could be a $700 stock by 2030, making it a solid long-term investment.
Comparing Accenture to Competitors
To better understand Accenture’s position in the market, let’s compare it to similar companies in the consulting and technology space.
| Company | Market Cap (in Billion USD) | P/E Ratio | Dividend Yield |
|---|---|---|---|
| Accenture (ACN) | 224.14 | 30.14 | 1.65% |
| IBM (IBM) | 237.23 | 21.5 | 4.10% |
| Infosys (INFY) | 86.04 | 24.3 | 2.50% |
| Cognizant (CTSH) | 41.62 | 16.8 | 1.50% |
| Wipro (WIT) | 35.24 | 20.5 | 1.20% |
Accenture outperforms competitors in terms of growth and revenue expansion. While IBM offers a higher dividend yield, Accenture’s AI and cloud investments provide a better long-term growth outlook.
Indicator-Based Stock Analysis
Technical indicators help us assess whether Accenture is a buy, hold, or sell right now.
📊 Stock Indicators
| Indicator | Value | Interpretation |
|---|---|---|
| 50-Day Moving Average | $372.45 | Neutral |
| 200-Day Moving Average | $355.60 | Bullish |
| Relative Strength Index (RSI) | 55 | Neutral |
| MACD (Moving Average Convergence Divergence) | Positive | Bullish |
✅ Conclusion: The stock is trading near support levels and has bullish momentum for 2025.
Should You Buy Accenture Stock?

📌 Pros:
✅ Strong Financials: Revenue and earnings are growing steadily.
✅ AI & Digital Growth: Expansion into AI and cloud services fuels long-term value.
✅ Dividend Stock: 1.65% yield offers consistent income.
✅ Analyst Ratings: Most analysts recommend buying ACN stock.
⚠️ Risks:
❌ Market Volatility: Economic downturns can temporarily affect stock performance.
❌ High Valuation: A P/E ratio of 30+ means the stock is not “cheap.”
❌ Tech Disruptions: Competition from AI-focused firms could impact future revenue.
Final Verdict:
📢 If you’re a long-term investor, Accenture is a solid buy. With strong earnings, AI-driven growth, and a history of resilience, ACN stock is well-positioned to deliver consistent returns through 2030 and beyond.
Accenture (ACN) Price Forecast Tables 2025-2030
2025 Price Forecast Table
| Month | Minimum Price | Maximum Price | % Change from Current |
|---|---|---|---|
| March | $355.00 | $395.00 | -1.51% to +9.59% |
| April | $360.00 | $400.00 | -0.12% to +10.97% |
| May | $365.00 | $405.00 | +1.26% to +12.36% |
| June | $370.00 | $410.00 | +2.65% to +13.75% |
| July | $375.00 | $415.00 | +4.04% to +15.14% |
| August | $380.00 | $420.00 | +5.42% to +16.52% |
| September | $385.00 | $425.00 | +6.81% to +17.91% |
| October | $390.00 | $430.00 | +8.20% to +19.30% |
| November | $395.00 | $435.00 | +9.59% to +20.68% |
| December | $400.00 | $440.00 | +10.97% to +22.07% |
2026 Price Forecast Table
| Month | Minimum Price | Maximum Price | % Change from Current |
|---|---|---|---|
| January | $405.00 | $445.00 | +12.36% to +23.46% |
| February | $410.00 | $450.00 | +13.75% to +24.84% |
| March | $415.00 | $455.00 | +15.14% to +26.23% |
| April | $420.00 | $460.00 | +16.52% to +27.62% |
| May | $425.00 | $465.00 | +17.91% to +29.01% |
| June | $430.00 | $470.00 | +19.30% to +30.39% |
| July | $435.00 | $475.00 | +20.68% to +31.78% |
| August | $440.00 | $480.00 | +22.07% to +33.17% |
| September | $445.00 | $485.00 | +23.46% to +34.55% |
| October | $450.00 | $490.00 | +24.84% to +35.94% |
| November | $455.00 | $495.00 | +26.23% to +37.33% |
| December | $460.00 | $500.00 | +27.62% to +38.72% |
2027 Price Forecast Table
| Month | Minimum Price | Maximum Price | % Change from Current |
|---|---|---|---|
| January | $465.00 | $505.00 | +29.01% to +40.10% |
| February | $470.00 | $510.00 | +30.39% to +41.49% |
| March | $475.00 | $515.00 | +31.78% to +42.88% |
| April | $480.00 | $520.00 | +33.17% to +44.26% |
| May | $485.00 | $525.00 | +34.55% to +45.65% |
| June | $490.00 | $530.00 | +35.94% to +47.04% |
| July | $495.00 | $535.00 | +37.33% to +48.43% |
| August | $500.00 | $540.00 | +38.72% to +49.81% |
| September | $505.00 | $545.00 | +40.10% to +51.20% |
| October | $510.00 | $550.00 | +41.49% to +52.59% |
| November | $515.00 | $555.00 | +42.88% to +53.97% |
| December | $520.00 | $560.00 | +44.26% to +55.36% |
2028 Price Forecast Table
| Month | Minimum Price | Maximum Price | % Change from Current |
|---|---|---|---|
| January | $525.00 | $565.00 | +45.65% to +56.75% |
| February | $530.00 | $570.00 | +47.04% to +58.14% |
| March | $535.00 | $575.00 | +48.43% to +59.52% |
| April | $540.00 | $580.00 | +49.81% to +60.91% |
| May | $545.00 | $585.00 | +51.20% to +62.30% |
| June | $550.00 | $590.00 | +52.59% to +63.68% |
| July | $555.00 | $595.00 | +53.97% to +65.07% |
| August | $560.00 | $600.00 | +55.36% to +66.46% |
| September | $565.00 | $605.00 | +56.75% to +67.85% |
| October | $570.00 | $610.00 | +58.14% to +69.23% |
| November | $575.00 | $615.00 | +59.52% to +70.62% |
| December | $580.00 | $620.00 | +60.91% to +72.01% |
2029 Price Forecast Table
| Month | Minimum Price | Maximum Price | % Change from Current |
|---|---|---|---|
| January | $585.00 | $625.00 | +62.30% to +73.39% |
| February | $590.00 | $630.00 | +63.68% to +74.78% |
| March | $595.00 | $635.00 | +65.07% to +76.17% |
| April | $600.00 | $640.00 | +66.46% to +77.56% |
| May | $605.00 | $645.00 | +67.85% to +78.94% |
| June | $610.00 | $650.00 | +69.23% to +80.33% |
| July | $615.00 | $655.00 | +70.62% to +81.72% |
| August | $620.00 | $660.00 | +72.01% to +83.10% |
| September | $625.00 | $665.00 | +73.39% to +84.49% |
| October | $630.00 | $670.00 | +74.78% to +85.88% |
| November | $635.00 | $675.00 | +76.17% to +87.27% |
| December | $640.00 | $680.00 | +77.56% to +88.65% |
2030 Price Forecast Table
| Month | Minimum Price | Maximum Price | % Change from Current |
|---|---|---|---|
| January | $645.00 | $685.00 | +78.94% to +90.04% |
| February | $650.00 | $690.00 | +80.33% to +91.43% |
| March | $655.00 | $695.00 | +81.72% to +92.81% |
| April | $660.00 | $700.00 | +83.10% to +94.20% |
| May | $665.00 | $705.00 | +84.49% to +95.59% |
| June | $670.00 | $710.00 | +85.88% to +96.98% |
| July | $675.00 | $715.00 | +87.27% to +98.36% |
| August | $680.00 | $720.00 | +88.65% to +99.75% |
| September | $685.00 | $725.00 | +90.04% to +101.14% |
| October | $690.00 | $730.00 | +91.43% to +102.52% |
| November | $695.00 | $735.00 | +92.81% to +103.91% |
| December | $700.00 | $740.00 | +94.20% to +105.30% |
I’ve examined the financial information for Accenture (ACN). Let me summarize the key points from the balance sheet and income statement data.
Financial Overview of Accenture
Income Statement Highlights
- Revenue Growth: 2.75% YoY (TTM)
- Operating Income: $10.21B
- Net Income Growth: 10.03% YoY
- Free Cash Flow: $9.06B
- Dividend Per Share: $5.54 (1.64% yield)
Key Financial Metrics
- Gross Margin: 32.45%
- Operating Margin: 15.39%
- Profit Margin: 11.41%
- Free Cash Flow Margin: 13.65%
- EBITDA Margin: 17.12%
Analyst Outlook
- Consensus: Buy
- Average Price Target: $390.85 (8.41% upside potential)
- Next Earnings Date: March 20, 2025
The company shows solid financial health with consistent growth in earnings despite modest revenue growth. Accenture maintains strong margins and generates substantial free cash flow, supporting its dividend program and potential future investments.
Would you like more detailed analysis on any particular aspect of Accenture’s financials?
📌 Disclaimer:
This article is for informational purposes only and should not be considered financial advice. Always conduct your own research or consult a professional before making investment decisions.