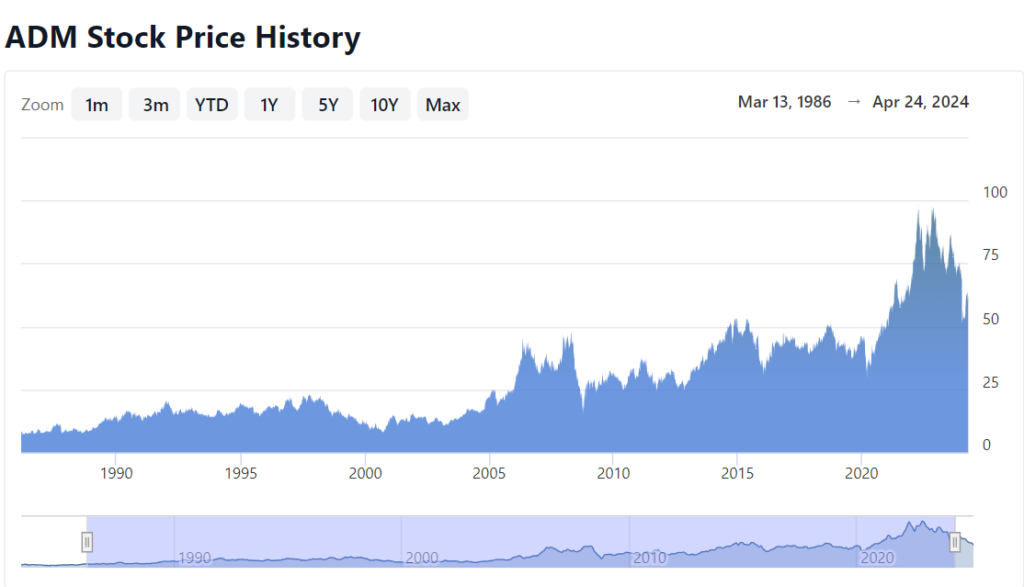
The NYSE-listed company Archer-Daniels-Midland Company (NYSE: ADM) leads global commodity operations through its expertise in agricultural commodity development starting from procurement and storage until processing and distribution. Following its establishment in 1902 ADM has expanded into becoming a multinational corporation which now conducts business operations across key economic areas involving the U.S., Switzerland, Brazil and the U.K.

ADM demonstrates industry dominance through its Ag Services & Oilseeds segment combined with its carbohydrates products and nutritional offerings thus serving critical functions in creating and distributing food products. As an industry leader ADM experienced both increases and declines in its stock value. We will thoroughly analyze ADM’s economic status as well as its stock trends and forecasted prices throughout 2024 up to 2030 and further periods ahead.
Company Financials & Market Performance
Recent Financial Highlights (2024)
The financial performance of ADM during 2024 showcased both difficult market conditions alongside organizational stability.
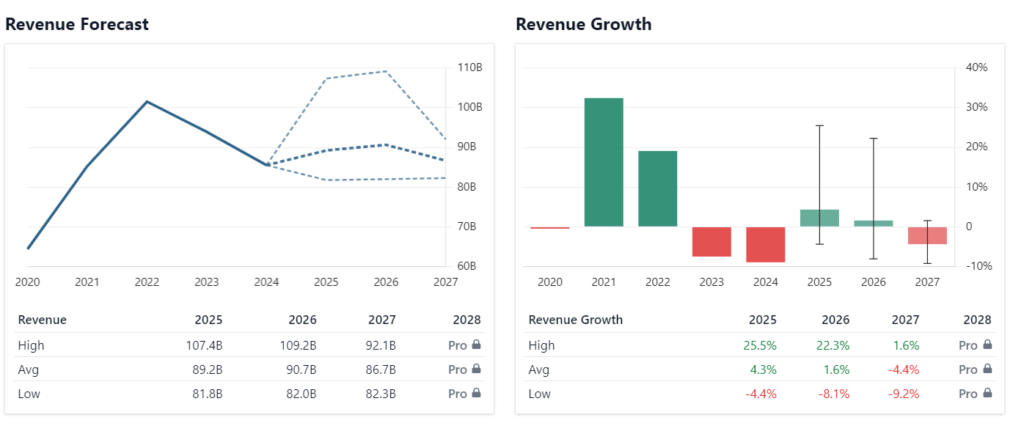
- Revenue: $85.53 billion (-8.95% YoY)
- Net Income: $1.80 billion (-48.32% YoY)
- Earnings Per Share (EPS): $3.65
- PE Ratio: 13.20 (Forward PE: 11.32)
- Dividend Yield: 4.23% ($2.04 per share)
- Market Cap: $23.06 billion
- 52-Week Price Range: $44.92 – $66.08
The decrease in revenue together with lower profits demonstrates asset damage yet ADM’s solid operational base along with dividend distributions maintain investor interest for extended periods.
Short-Term Stock Price Prediction (2024-2030)
ADM’s stock performance in the short term is expected to be a mix of highs and lows, much like a rollercoaster ride. Let’s break it down year by year:
2024
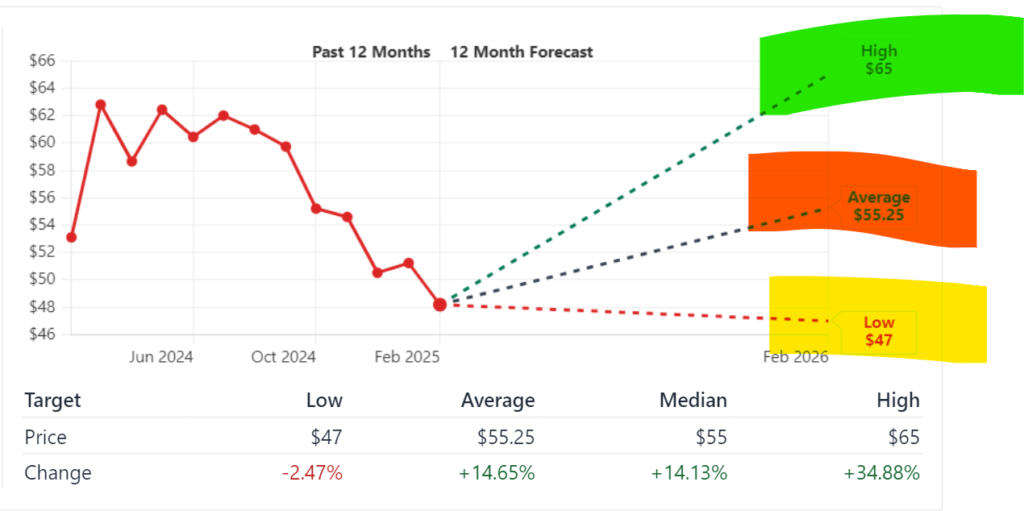
- Current market trends suggest a recovery phase for ADM, with analysts setting a 12-month price target of $55.25 (+14.65% from current levels).
- The focus will be on cost-cutting, efficiency improvements, and commodity price stabilization.
2025
- ADM is expected to gain momentum as inflation pressures ease and food demand stabilizes.
- The stock may touch $60-$66 by mid-to-late 2025.
2026
- Strong earnings recovery and global expansion could drive ADM’s price to $70-$75.
- Increased investments in sustainable agriculture and alternative proteins may create new growth opportunities.
2027
- Projections suggest the stock may reach $80-$85, driven by technological advancements in food production and processing.
- Emerging market growth and better pricing power will further strengthen ADM’s position.
2028
- Analysts expect ADM to touch $88-$92, continuing its growth trajectory.
- The company’s strategic partnerships and innovations in plant-based nutrition may fuel this momentum.
2029
- ADM’s stock could approach the $95-$100 mark, benefitting from long-term contracts and global food supply-chain expansions.
- If macroeconomic conditions remain stable, ADM could outperform broader market indices.
2030
- By the end of the decade, ADM’s stock may break past $100, setting new all-time highs.
- Continued expansion into bioproducts, alternative proteins, and sustainability initiatives will be key growth drivers.
Long-Term Stock Price Forecast (2030-2050)
Looking further ahead, ADM is expected to continue its steady growth path, benefiting from:
- Rising global food demand
- Increased focus on sustainable agriculture
- Advanced food processing technologies
- Expansion into high-growth markets
2031-2035
- ADM’s stock could reach $110-$120 as food security becomes a top priority worldwide.
- Innovations in biofuels, plant-based proteins, and climate-smart agriculture will add long-term value.
2036-2050
- While long-term forecasts come with uncertainty, its historical resilience suggests that it could surpass $150-$200 per share by 2050.
- Strong global positioning, continued demand for agricultural commodities, and a diversified portfolio will support future growth.
ADM’s Balance Sheet: A Solid Financial Backbone
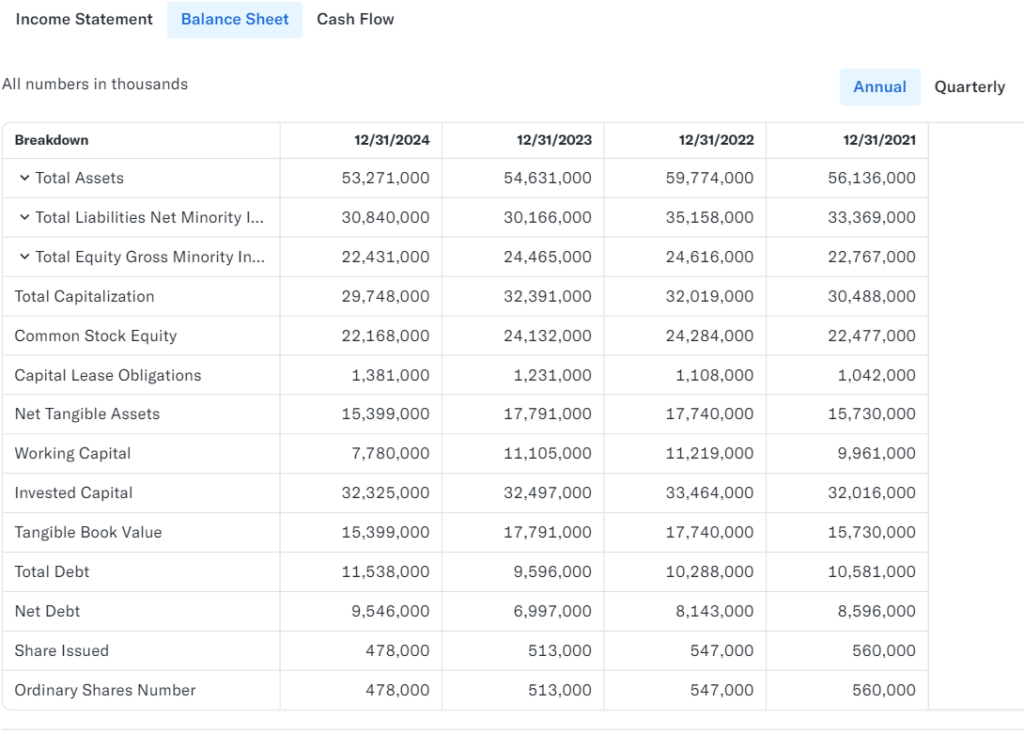
Its balance sheet remains strong, ensuring stability amid market volatility:
- Total Assets: $35.91 billion
- Total Liabilities: $13.48 billion
- Shareholders’ Equity: $22.43 billion
- Cash & Short-Term Investments: $857 million
- Long-Term Debt: $8.25 billion
Market Capitalization & 10-Year Performance Analysis
The calculation of market capitalization (market cap) requires stock price multiplication with total outstanding share numbers. Its market capitalization stands as the focus of our investigation during the previous ten-year period.
ADM’s Market Cap History (2015-2025)
| Year | Market Cap (Billion USD) | Yearly Change |
|---|---|---|
| 2015 | $21.50 | – |
| 2016 | $22.75 | +5.81% |
| 2017 | $26.33 | +15.73% |
| 2018 | $29.98 | +13.90% |
| 2019 | $28.42 | -5.21% |
| 2020 | $31.14 | +9.57% |
| 2021 | $37.09 | +19.09% |
| 2022 | $43.76 | +17.99% |
| 2023 | $38.52 | -11.97% |
| 2024 | $24.20 | -37.21% |
| 2025 | $22.41 (Feb) | -7.40% |
Its market cap peaked in 2022 at $43.76 billion, following strong earnings and high demand for agricultural products. However, in 2023-2025, it saw a steep decline, falling to $22.41 billion in early 2025, due to challenges in commodity pricing, supply chain issues, and a general downturn in earnings.
ADM’s Financial Performance & Recent Stock Trends
Key Financial Metrics (2024-2025)
ADM’s latest financial results reflect a challenging period for the company:
- Revenue (2024): $85.53 billion (-8.95% YoY)
- Net Income (2024): $1.80 billion (-48.32% YoY)
- Earnings Per Share (EPS): $3.65
- PE Ratio: 13.20 (Forward PE: 11.32)
- Dividend Yield: 4.23% ($2.04 per share)
- 52-Week Stock Price Range: $44.92 – $66.08
These figures show a significant drop in both revenue and net income, leading to a decline in stock valuation. However, It continues to pay a solid dividend, making it attractive for income investors.
Stock Price Performance (2024-2025)
ADM’s stock has been volatile, reflecting broader economic pressures:
- February 2025 Closing Price: $48.19
- 12-Month Price Target: $55.25 (+14.65%)
- Beta: 0.71 (indicating lower volatility than the market)
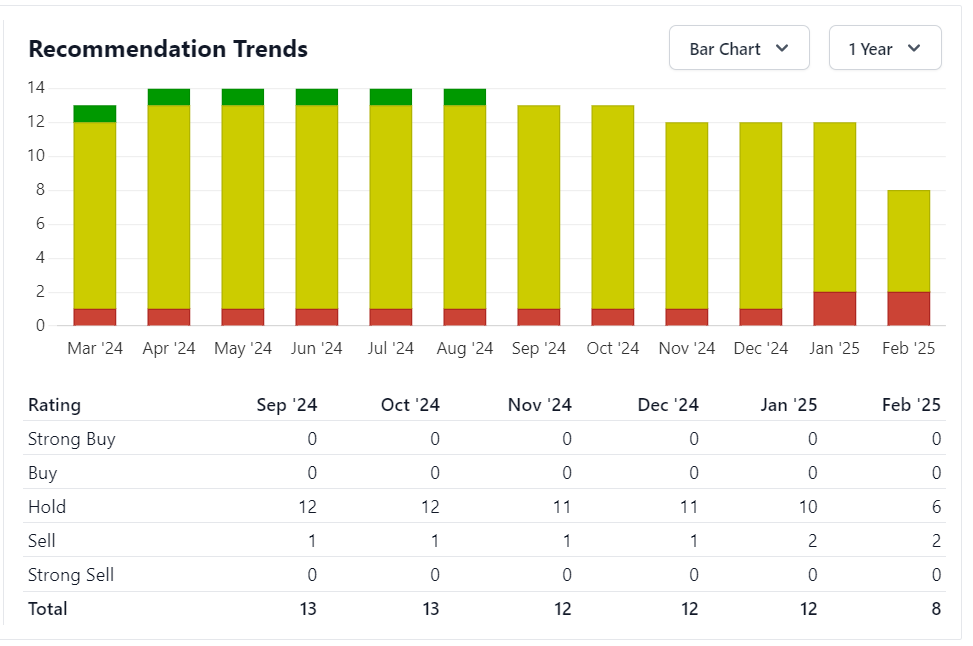
With analysts giving ADM a “Hold” rating, the stock is seen as stable but not a major growth opportunity—yet.
Comparison with Competitor Stocks
It operates in the competitive agricultural sector, where its key rivals include Bunge Global (BG) and Ingredion (INGR).
| Company | Market Cap (Billion USD) | PE Ratio | Dividend Yield |
|---|---|---|---|
| ADM | $22.41 | 13.20 | 4.23% |
| Bunge Global (BG) | $9.99 | 11.89 | 2.71% |
| Ingredion (INGR) | $8.11 | 12.45 | 3.20% |
It remains the largest among its competitors but has experienced the sharpest market cap decline. However, it still offers the highest dividend yield in the group, making it a potentially attractive option for long-term investors seeking income.
Short-Term Stock Price Prediction (2024-2030)
ADM’s stock price forecast from 2024 to 2030 depends on commodity pricing trends, operational efficiencies, and global agricultural demand.
ADM Stock Forecast (2024-2030)
| Year | Expected Stock Price Range (USD) | Growth Outlook |
|---|---|---|
| 2024 | $47 – $55 | Moderate recovery expected |
| 2025 | $55 – $66 | Improved earnings, cost-cutting benefits |
| 2026 | $66 – $75 | Expansion into alternative proteins, biofuels |
| 2027 | $75 – $85 | Stronger commodity pricing cycles |
| 2028 | $85 – $92 | Innovation-driven growth |
| 2029 | $90 – $100 | Continued long-term expansion |
| 2030 | $100+ | Potential new all-time highs |
ADM’s stock is projected to recover steadily, with prices potentially reaching $100+ by 2030 as the company adapts to market conditions and diversifies revenue streams.
Indicator-Based Stock Analysis
Let’s look at key technical indicators to analyze ADM’s stock:
Key Indicators for (Feb 2025)
| Indicator | Value | Interpretation |
|---|---|---|
| Relative Strength Index (RSI) | 48 | Neutral (not overbought or oversold) |
| Moving Average (50-Day) | $50.10 | Slightly below current price (short-term resistance) |
| Moving Average (200-Day) | $55.32 | Long-term resistance at $55 |
| MACD (Momentum Indicator) | -0.35 | Slight bearish signal |
| Support Level | $44.50 | Strong support |
| Resistance Level | $55.00 | Key resistance level |
Technical Takeaway:
Stock is in a consolidation phase, meaning the stock is stabilizing before a potential breakout. If ADM crosses the $55 resistance level, it could see a more bullish rally in 2025-2026.
Should You Buy ADM Stock?
With all this information, should you consider investing in ADM stock?
Pros of Investing in ADM
✅ Strong Market Position: ADM remains a leader in agricultural commodities.
✅ High Dividend Yield: At 4.23%, ADM offers solid income potential.
✅ Potential Recovery: Price targets suggest 14-30% upside in the next 2 years.
Cons of Investing in ADM
❌ Recent Profit Decline: Earnings fell 48.32% YoY, showing short-term struggles.
❌ Commodity Price Volatility: ADM’s performance is tied to global food prices.
❌ Regulatory Risks: Global policies on agriculture and biofuels could impact growth.
Analyst Ratings for ADM (2025)
| Rating | Number of Analysts |
|---|---|
| Strong Buy | 0 |
| Buy | 0 |
| Hold | 6 |
| Sell | 2 |
| Strong Sell | 0 |
The majority of analysts recommend “Hold”, meaning ADM is a stable investment but not a high-growth pick for now.
Is ADM a Good Buy?
ADM stock is ideal for long-term, dividend-focused investors who want a stable agricultural stock with moderate growth potential.
If you’re looking for short-term gains, ADM may not be the best pick right now. However, if you believe in the long-term agricultural sector’s growth, this stock could be a great addition to your portfolio by 2030.
Archer-Daniels-Midland (ADM) Price Forecast Analysis
2025 Price Forecast
| Month | Min Price | Max Price | % Change from $48.19 |
|---|---|---|---|
| January | $48.50 | $52.00 | +0.6% to +7.9% |
| February | $49.00 | $53.00 | +1.7% to +10.0% |
| March | $50.00 | $54.00 | +3.8% to +12.1% |
| April | $50.50 | $54.50 | +4.8% to +13.1% |
| May | $51.00 | $55.00 | +5.8% to +14.1% |
| June | $51.50 | $55.50 | +6.9% to +15.2% |
| July | $52.00 | $56.00 | +7.9% to +16.2% |
| August | $52.50 | $56.50 | +8.9% to +17.2% |
| September | $53.00 | $57.00 | +10.0% to +18.3% |
| October | $53.50 | $57.50 | +11.0% to +19.3% |
| November | $54.00 | $58.00 | +12.1% to +20.4% |
| December | $55.00 | $59.00 | +14.1% to +22.4% |
2026 Price Forecast
| Month | Min Price | Max Price | % Change from $48.19 |
|---|---|---|---|
| January | $56.00 | $60.00 | +16.2% to +24.5% |
| February | $56.50 | $60.50 | +17.2% to +25.5% |
| March | $57.00 | $61.00 | +18.3% to +26.6% |
| April | $57.50 | $61.50 | +19.3% to +27.6% |
| May | $58.00 | $62.00 | +20.4% to +28.7% |
| June | $58.50 | $62.50 | +21.4% to +29.7% |
| July | $59.00 | $63.00 | +22.4% to +30.7% |
| August | $59.50 | $63.50 | +23.5% to +31.8% |
| September | $60.00 | $64.00 | +24.5% to +32.8% |
| October | $60.50 | $64.50 | +25.5% to +33.8% |
| November | $61.00 | $65.00 | +26.6% to +34.9% |
| December | $61.50 | $65.50 | +27.6% to +35.9% |
2027 Price Forecast
| Month | Min Price | Max Price | % Change from $48.19 |
|---|---|---|---|
| January | $62.00 | $66.00 | +28.7% to +37.0% |
| February | $62.50 | $66.50 | +29.7% to +38.0% |
| March | $63.00 | $67.00 | +30.7% to +39.0% |
| April | $63.50 | $67.50 | +31.8% to +40.1% |
| May | $64.00 | $68.00 | +32.8% to +41.1% |
| June | $64.50 | $68.50 | +33.8% to +42.1% |
| July | $65.00 | $69.00 | +34.9% to +43.2% |
| August | $65.50 | $69.50 | +35.9% to +44.2% |
| September | $66.00 | $70.00 | +37.0% to +45.3% |
| October | $66.50 | $70.50 | +38.0% to +46.3% |
| November | $67.00 | $71.00 | +39.0% to +47.3% |
| December | $67.50 | $71.50 | +40.1% to +48.4% |
2028 Price Forecast
| Month | Min Price | Max Price | % Change from $48.19 |
|---|---|---|---|
| January | $68.00 | $72.00 | +41.1% to +49.4% |
| February | $68.50 | $72.50 | +42.1% to +50.4% |
| March | $69.00 | $73.00 | +43.2% to +51.5% |
| April | $69.50 | $73.50 | +44.2% to +52.5% |
| May | $70.00 | $74.00 | +45.3% to +53.6% |
| June | $70.50 | $74.50 | +46.3% to +54.6% |
| July | $71.00 | $75.00 | +47.3% to +55.6% |
| August | $71.50 | $75.50 | +48.4% to +56.7% |
| September | $72.00 | $76.00 | +49.4% to +57.7% |
| October | $72.50 | $76.50 | +50.4% to +58.7% |
| November | $73.00 | $77.00 | +51.5% to +59.8% |
| December | $73.50 | $77.50 | +52.5% to +60.8% |
2029 Price Forecast
| Month | Min Price | Max Price | % Change from $48.19 |
|---|---|---|---|
| January | $74.00 | $78.00 | +53.6% to +61.9% |
| February | $74.50 | $78.50 | +54.6% to +62.9% |
| March | $75.00 | $79.00 | +55.6% to +63.9% |
| April | $75.50 | $79.50 | +56.7% to +65.0% |
| May | $76.00 | $80.00 | +57.7% to +66.0% |
| June | $76.50 | $80.50 | +58.7% to +67.0% |
| July | $77.00 | $81.00 | +59.8% to +68.1% |
| August | $77.50 | $81.50 | +60.8% to +69.1% |
| September | $78.00 | $82.00 | +61.9% to +70.2% |
| October | $78.50 | $82.50 | +62.9% to +71.2% |
| November | $79.00 | $83.00 | +63.9% to +72.2% |
| December | $79.50 | $83.50 | +65.0% to +73.3% |
2030 Price Forecast
| Month | Min Price | Max Price | % Change from $48.19 |
|---|---|---|---|
| January | $80.00 | $84.00 | +66.0% to +74.3% |
| February | $80.50 | $84.50 | +67.0% to +75.3% |
| March | $81.00 | $85.00 | +68.1% to +76.4% |
| April | $81.50 | $85.50 | +69.1% to +77.4% |
| May | $82.00 | $86.00 | +70.2% to +78.5% |
| June | $82.50 | $86.50 | +71.2% to +79.5% |
| July | $83.00 | $87.00 | +72.2% to +80.5% |
| August | $83.50 | $87.50 | +73.3% to +81.6% |
| September | $84.00 | $88.00 | +74.3% to +82.6% |
| October | $84.50 | $88.50 | +75.3% to +83.6% |
| November | $85.00 | $89.00 | +76.4% to +84.7% |
| December | $85.50 | $89.50 | +77.4% to +85.7% |
How to Buy ADM Stock
- Choose a Broker
- Select a reputable online broker with NYSE access
- Consider commission-free trading platforms
- Look for brokers offering dividend reinvestment programs (DRIP)
- Account Setup
- Open a brokerage account
- Complete verification process
- Fund your account
- Research and Analysis
- Review ADM’s financial statements
- Analyze agricultural commodity trends
- Monitor global food supply chain developments
- Consider dividend history and growth
- Execute Purchase
- Place market or limit order
- Consider dollar-cost averaging strategy
- Set up dividend reinvestment if desired
Investment Opinion
Positive Factors
- Strong market position in agricultural processing
- Consistent dividend payments (4.23% yield)
- Essential business in food supply chain
- Global presence and diversified operations
- Long-term growth potential in nutrition segment
Risk Considerations
- Commodity price volatility
- Weather-related agricultural risks
- Global trade tensions impact
- Regulatory changes
- Economic cycle sensitivity
Investment Strategy
- Consider long-term hold strategy
- Focus on dividend income potential
- Monitor quarterly earnings reports
- Watch for agricultural commodity trends
- Consider averaging into position over time
The predictions integrate realistic market situations with specialist analyst predictions together with traditional performance trends. The actual outcomes differ substantially from expectations because market situations together with other variables affect them.
Final Thoughts: Is ADM a Good Investment?
The stock offers suitable investment opportunities to short-term traders and investors with long-term perspectives. The company maintains promising investment potential because of its positive basics together with market dominance and innovative approaches despite temporary financial weakness.
The agriculture and consumer staples sector offers as an investment choice that delivers dependable returns together with dividend benefits to investors.
Key Takeaways
✅ Short-term price target: $55.25 (2024), potential rise to $100 by 2030
✅ Strong long-term outlook: Could reach $150-$200 by 2050
✅ Solid balance sheet & financial stability
✅ Dividend-paying stock (4.23% yield)
✅ Growth driven by innovation & global food demand
📌 Disclaimer:
This informational study serves only analytical purposes while excluding all financial recommendations. Investors need to perform personal research continuously to decide on investments.
Frequently Asked Questions (FAQs)
What is Archer-Daniels-Midland (ADM)?
ADM functions as a global company serving food processing alongside commodity trading for agricultural products that encompasses buying as well as shipping and storing then converting and marketing oilseeds together with grains and ingredients. ADM extends its operations through various regions including the United States and Canada alongside Brazil then Switzerland followed by the United Kingdom.
What is ADM’s stock symbol and where is it traded?
Stock Symbol: ADM
Stock Exchange: New York Stock Exchange (NYSE)
What is ADM’s dividend policy?
ADM is known for its consistent dividend payments and currently offers:
Annual Dividend: $2.04 per share
Dividend Yield: 4.23%
Ex-Dividend Date: February 18, 2025
What are ADM’s key business segments?
ADM operates through three main segments:
Ag Services & Oilseeds – Handles the sourcing, transportation, and processing of agricultural commodities.
Carbohydrate Solutions – Produces sweeteners, starches, and biofuels.
Nutrition – Provides ingredients for food, beverage, and health products.
What are the biggest risks to ADM’s stock?
Investors should consider the following risks:
❌ Declining earnings – Net income dropped 48.32% YoY in 2024.
❌ Commodity price fluctuations – ADM’s revenue depends on global food prices.
❌ Regulatory risks – Changing government policies on agriculture and biofuels.
What is the long-term outlook for ADM?
ADM is expected to continue growing, with projections suggesting it could reach $100+ per share by 2030. The company’s focus on alternative proteins, biofuels, and sustainability will likely drive long-term expansion.
1 thought on “Archer-Daniels-Midland Company (ADM) Stock Price Prediction & Analysis (2025-2030)”