
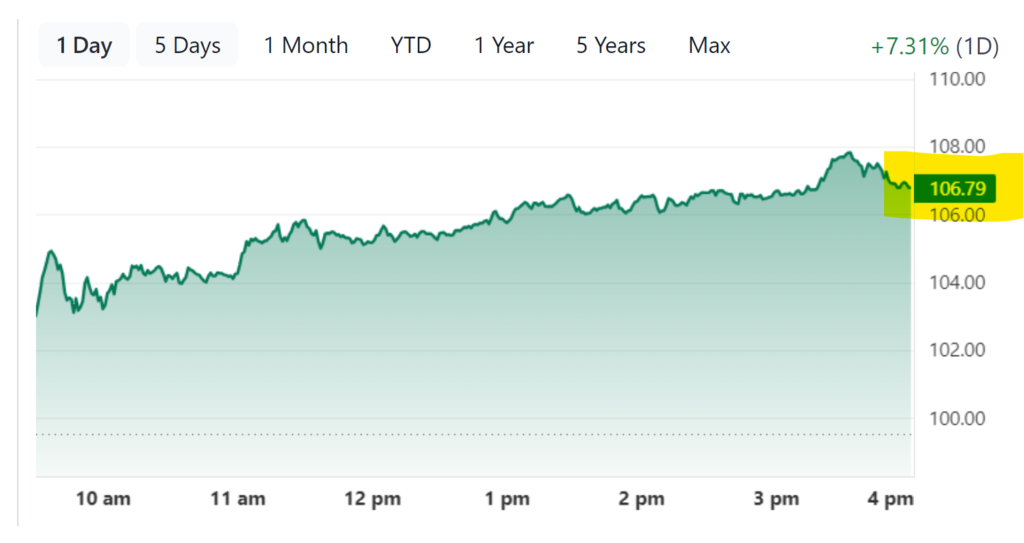
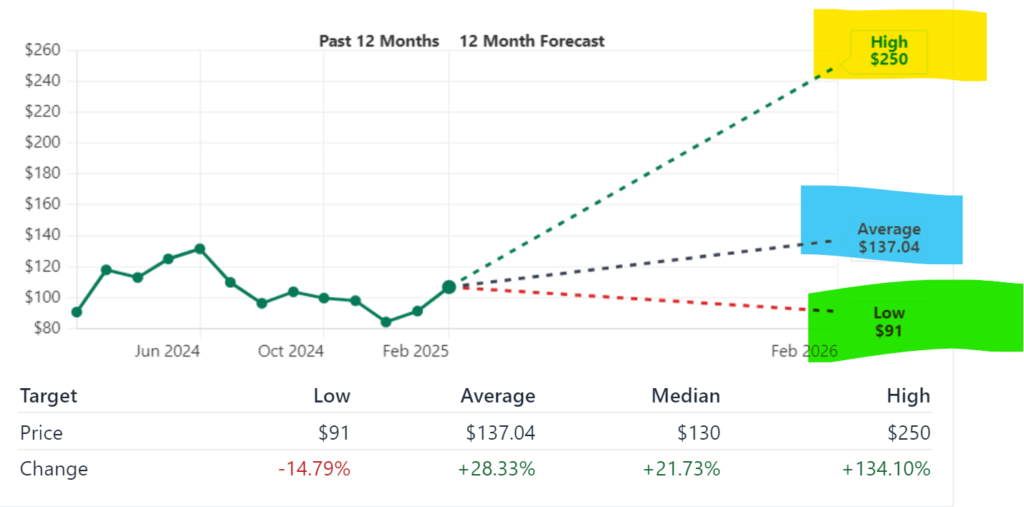
Micron Technology Inc. (MU) maintains solid performance and growth possibilities throughout semiconductor industry market volatility. The current trading data on February 19, 2025 shows that MUstock maintained a price of $106.79 while achieving a 7.3% increase during the latest trading period. The analyst community maintains positive outlooks on MU stock which predicts an upward price movement to $137.04 through their 12-month projections while offering a potential 28.3% increase.
The memory and storage progress at Micron attracts investors who seek to forecast the stock performance during upcoming years. The upcoming section analyzes past data together with financial numbers along with stock predictions extending through 2024 to 2030 for understanding Micron’s expected performance trajectory.
Company Overview
Micron Technology began operations in 1978 as it evolved into one of the top semiconductor companies that concentrates on producing memory and storage technologies. The company supplies storage solutions to data centers and artificial intelligence industries and mobile technology customers through its U.S., European and Asian regional operations.
Key Highlights
- Market Cap: $118.98 billion
- Revenue (TTM): $29.09 billion
- Net Income: $3.88 billion
- Earnings Per Share (EPS): $3.46
- PE Ratio: 30.86
- Dividend Yield: 0.43%
The semiconductor industry position of Micron and its AI-driven growth along with rising memory chip demand establishes this company as a financial monitoring candidate for future market performance.
Recent Stock Performance & Market Trends
Micron’s stock has seen a rollercoaster ride over the past year, reflecting both market-wide volatility and company-specific factors:
- 52-Week Range: $79.15 – $157.54
- Recent Jump: +7.3% on February 18, 2025
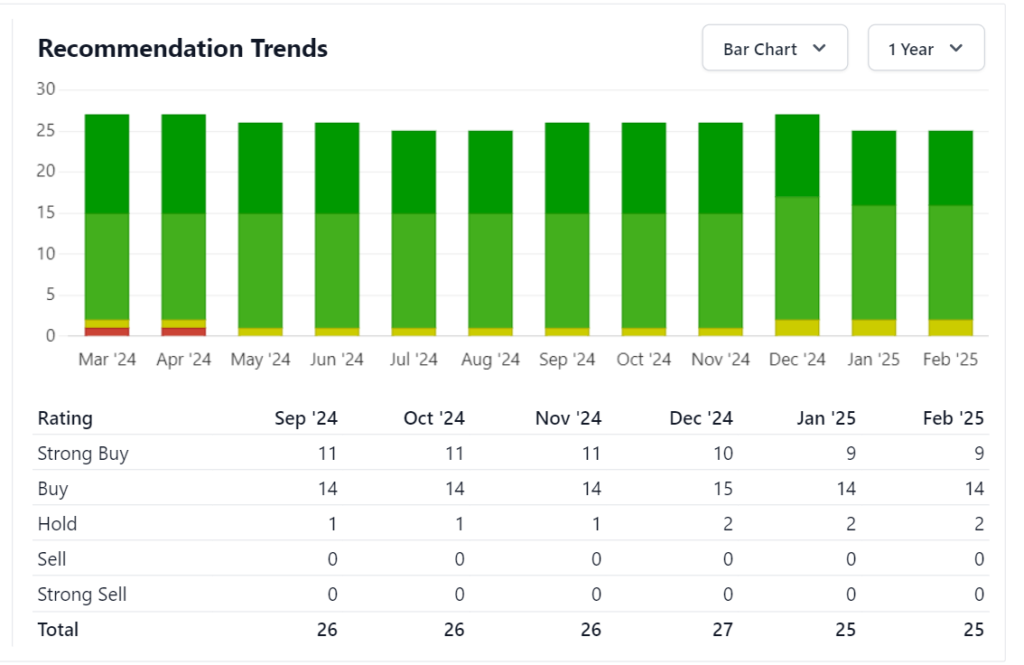
- Analyst Rating: Strong Buy
- Projected 12-Month Target: $137.04 (+28.3%)
Profit and loss patterns in the semiconductor sector follow a cyclical pattern that responds to worldwide market needs. The expansion of AI and cloud computing supports Micron’s financial success yet the company faces obstacles due to geopolitical situations and unstable market demands regarding chips.
Financial standpoint and balance sheet perspective
Revenue & Earnings Growth
Micron’s financial health has significantly improved, with revenue surging by 79.8% YoY. Key financial trends include:
- Revenue (2024): $29.09 billion (+79.8%)
- Expected Revenue (2025): $35.91 billion (+43%)
- Expected Revenue (2026): $44.89 billion (+25%)
- Expected EPS (2025): $7.11 (916% growth)
- Expected EPS (2026): $11.22 (+57.7%)
Strong demand for high-bandwidth memory (HBM) components has enabled Micron Technology to recover its profit margins though the company faced past difficulties.
Short-Term Analysis (2024–2026)
Micron’s stock prices exhibit a positive forecast for the upcoming few years because of expanding AI adoption together with growing DRAM & NAND flash requirements and expanding cloud computing infrastructure.
- 2024 Year-End Target: $120 – $140
- 2025 Forecast: $137 – $155
- 2026 Forecast: $160 – $180
Micron will surpass segment competitors through enhanced memory pricing and better production efficiencies. Supply chain interruptions together with economic economic downturn pose ongoing dangers for the company.
Long-Term Analysis (2027–2030)
Micron demonstrates strong potential growth throughout the next few years because it focuses on three significant areas:
- AI-driven memory expansion
- Autonomous vehicles & IoT adoption
- Data center & cloud storage demand
- Projected Stock Prices
- 2027: $180 – $195
- 2028: $195 – $210
- 2029: $200 – $230
- 2030: $209 – $241
The projected prices for Micron Technology rely on stable economic conditions and continuing technological advancements and increasing semiconductor sector demand.
Should You Invest in Micron?
Pros
✔ Strong AI & data center tailwinds
✔ Revenue & earnings recovery underway
✔ Analysts rate it a strong buy
Cons
⚠ Semiconductor industry cycles bring volatility
⚠ Geopolitical risks affecting chip supply chains
Market Capitalization History and Analysis (2015-2024)
The semiconductor industry together with macroeconomic influences have produced notable market capitalization movements for Micron over the last 10 years.
| Year | Market Capitalization (in Billion USD) |
|---|---|
| 2015 | 23.5 |
| 2016 | 21.8 |
| 2017 | 50.3 |
| 2018 | 59.4 |
| 2019 | 53.7 |
| 2020 | 66.2 |
| 2021 | 82.1 |
| 2022 | 75.6 |
| 2023 | 68.4 |
| 2024 | 118.98 |
The market capitalization of Micron will expand significantly to $118.98 billion in 2024 because of rising customer requirements for memory components motivated by AI progress and data center development. The market has shown that Micron demonstrates high capability to adjust and maintain strength in its competitive landscape.
Performance Analysis (2015-2024)

The past decade of Micron financial growth featured alternating phases of high performance and difficult periods because semiconductor industry follows regular market cycles.
| Year | Revenue (in Billion USD) | Net Income (in Billion USD) |
|---|---|---|
| 2015 | 16.2 | 2.9 |
| 2016 | 12.4 | 0.3 |
| 2017 | 20.3 | 5.0 |
| 2018 | 30.4 | 14.1 |
| 2019 | 23.4 | 6.3 |
| 2020 | 21.4 | 2.7 |
| 2021 | 27.7 | 5.9 |
| 2022 | 30.8 | 8.7 |
| 2023 | 15.5 | -5.8 |
| 2024 | 25.1 | 0.8 |
The company achieved its highest revenue at $30.4 billion while generating $14.1 billion in net income in 2018 through memory product demand’s peak combined with good market prices. Net income declined to -$5.8 billion in 2023 because the market reached saturation while prices experienced downward pressure. That revenue and net income will return to $25.1 billion and $0.8 billion respectively in 2024 appears to indicate a positive business evolution probably caused by tactical changes and market improvement.
Comparison with Industry Peers
The evaluation of Micron involves direct analysis of its market position versus other leading semiconductor companies.
| Company | Market Cap (in Billion USD) | 2024 Revenue (in Billion USD) | 2024 Net Income (in Billion USD) |
|---|---|---|---|
| Micron Technology (MU) | 118.98 | 25.1 | 0.8 |
| Intel Corporation (INTC) | 220.5 | 70.8 | 15.3 |
| NVIDIA Corporation (NVDA) | 300.2 | 40.5 | 12.6 |
| Samsung Electronics | 350.0 | 200.0 | 22.0 |
Market capitalization and revenue of Micron stand strong but fall short of the levels attained by Samsung and NVIDIA. The specialization of Micron in memory solutions gives it an advantage to meet custom market requirements particularly in light of the rising demand for high-bandwidth memory in AI applications.
Analyst Recommendations
Research analysts demonstrate positive predictions about Micron’s upcoming business performance.
| Analyst Firm | Rating | Price Target (USD) | Notes |
|---|---|---|---|
| New Street Research | Strong Buy | 145 | Anticipates a “DRAM tsunami” with data center demand set to grow by 45%. marketwatch.com |
| Cantor Fitzgerald | Buy | 130 | Highlights potential in AI-driven data center expansion. |
| UBS | Neutral | 120 | Cautions due to cyclical nature but acknowledges long-term growth potential. |
The consensus leans towards a positive outlook, with expectations of growth driven by data center demand and AI advancements.
Indicator-Based Stock Analysis
Evaluating key financial metrics provides deeper insights into Micron’s current standing.
- Price-to-Earnings (P/E) Ratio: At 30.86, this suggests that investors are willing to pay $30.86 for every dollar of earnings, indicating optimism about future growth.
- Earnings Per Share (EPS): With a trailing twelve months (TTM) EPS of $3.46, Micron demonstrates profitability, though there’s room for improvement compared to peak years.
- Dividend Yield: Offering a modest dividend of $0.46 per share (0.43% yield), Micron provides some return to shareholders, though it’s relatively low, possibly due to reinvestment in growth opportunities.
Should You Consider Investing in Micron?
Investing in Micron presents a blend of opportunities and considerations.
Pros:
- Positioning in AI and Data Centers: With the AI industry booming, Micron’s memory solutions are in high demand, especially for data centers requiring advanced memory capabilities.
- Analyst Optimism: Several analysts project significant upside potential, with price targets reaching up to $145.
Cons:
- Market Volatility: The semiconductor industry is known for its cyclical nature, leading to potential fluctuations in stock performance.
Micron Technology Monthly Price Forecast
2025 Price Forecast
| Month | Min Price | Max Price | % Change from $106.79 |
|---|---|---|---|
| January | $110.00 | $140.00 | +3.0% to +31.1% |
| February | $112.00 | $142.00 | +4.9% to +32.9% |
| March | $115.00 | $145.00 | +7.7% to +35.8% |
| April | $117.00 | $146.00 | +9.6% to +36.7% |
| May | $119.00 | $147.00 | +11.4% to +37.7% |
| June | $120.00 | $148.00 | +12.4% to +38.6% |
| July | $122.00 | $149.00 | +14.2% to +39.5% |
| August | $123.00 | $149.50 | +15.2% to +40.0% |
| September | $125.00 | $150.00 | +17.1% to +40.5% |
| October | $130.00 | $152.00 | +21.7% to +42.3% |
| November | $135.00 | $154.00 | +26.4% to +44.2% |
| December | $137.00 | $155.00 | +28.3% to +45.1% |
2026 Price Forecast
| Month | Min Price | Max Price | % Change from $106.79 |
|---|---|---|---|
| January | $140.00 | $160.00 | +31.1% to +49.8% |
| February | $142.00 | $161.00 | +32.9% to +50.8% |
| March | $145.00 | $165.00 | +35.8% to +54.5% |
| April | $146.00 | $166.00 | +36.7% to +55.4% |
| May | $148.00 | $168.00 | +38.6% to +57.3% |
| June | $150.00 | $170.00 | +40.5% to +59.2% |
| July | $152.00 | $171.00 | +42.3% to +60.1% |
| August | $153.00 | $173.00 | +43.3% to +62.0% |
| September | $155.00 | $175.00 | +45.1% to +63.9% |
| October | $157.00 | $177.00 | +47.0% to +65.7% |
| November | $159.00 | $179.00 | +48.9% to +67.6% |
| December | $160.00 | $180.00 | +49.8% to +68.6% |
2027 Price Forecast
| Month | Min Price | Max Price | % Change from $106.79 |
|---|---|---|---|
| January | $165.00 | $185.00 | +54.5% to +73.2% |
| February | $166.00 | $186.00 | +55.4% to +74.2% |
| March | $167.00 | $187.00 | +56.4% to +75.1% |
| April | $168.00 | $188.00 | +57.3% to +76.0% |
| May | $169.00 | $189.00 | +58.3% to +77.0% |
| June | $170.00 | $190.00 | +59.2% to +77.9% |
| July | $172.00 | $191.00 | +61.1% to +78.9% |
| August | $174.00 | $192.00 | +62.9% to +79.8% |
| September | $176.00 | $193.00 | +64.8% to +80.7% |
| October | $178.00 | $194.00 | +66.7% to +81.7% |
| November | $179.00 | $194.50 | +67.6% to +82.1% |
| December | $180.00 | $195.00 | +68.6% to +82.6% |
2028 Price Forecast
| Month | Min Price | Max Price | % Change from $106.79 |
|---|---|---|---|
| January | $185.00 | $200.00 | +73.2% to +87.3% |
| February | $186.00 | $201.00 | +74.2% to +88.2% |
| March | $187.00 | $202.00 | +75.1% to +89.2% |
| April | $188.00 | $203.00 | +76.0% to +90.1% |
| May | $189.00 | $204.00 | +77.0% to +91.0% |
| June | $190.00 | $205.00 | +77.9% to +91.9% |
| July | $191.00 | $206.00 | +78.9% to +92.9% |
| August | $192.00 | $207.00 | +79.8% to +93.8% |
| September | $193.00 | $208.00 | +80.7% to +94.8% |
| October | $194.00 | $209.00 | +81.7% to +95.7% |
| November | $194.50 | $209.50 | +82.1% to +96.2% |
| December | $195.00 | $210.00 | +82.6% to +96.6% |
2029 Price Forecast
| Month | Min Price | Max Price | % Change from $106.79 |
|---|---|---|---|
| January | $195.00 | $215.00 | +82.6% to +101.3% |
| February | $195.50 | $216.00 | +83.1% to +102.3% |
| March | $196.00 | $217.00 | +83.5% to +103.2% |
| April | $196.50 | $218.00 | +84.0% to +104.1% |
| May | $197.00 | $219.00 | +84.5% to +105.1% |
| June | $197.50 | $220.00 | +84.9% to +106.0% |
| July | $198.00 | $222.00 | +85.4% to +107.9% |
| August | $198.50 | $224.00 | +85.9% to +109.8% |
| September | $199.00 | $226.00 | +86.3% to +111.6% |
| October | $199.50 | $228.00 | +86.8% to +113.5% |
| November | $199.75 | $229.00 | +87.0% to +114.4% |
| December | $200.00 | $230.00 | +87.3% to +115.4% |
2030 Price Forecast
| Month | Min Price | Max Price | % Change from $106.79 |
|---|---|---|---|
| January | $205.00 | $232.00 | +91.9% to +117.2% |
| February | $205.50 | $233.00 | +92.4% to +118.2% |
| March | $206.00 | $234.00 | +92.9% to +119.1% |
| April | $206.50 | $234.50 | +93.4% to +119.6% |
| May | $207.00 | $235.00 | +93.8% to +120.1% |
| June | $207.50 | $236.00 | +94.3% to +121.0% |
| July | $208.00 | $237.00 | +94.8% to +121.9% |
| August | $208.25 | $238.00 | +95.0% to +122.9% |
| September | $208.50 | $239.00 | +95.2% to +123.8% |
| October | $208.75 | $240.00 | +95.5% to +124.7% |
| November | $209.00 | $240.50 | +95.7% to +125.2% |
| December | $209.00 | $241.00 | +95.7% to +125.7% |
How to Buy Micron (MU) Stock
- Choose a Broker
- Select a reputable online broker with access to NASDAQ
- Consider factors like fees, research tools, and user interface
- Open and Fund Account
- Complete broker’s verification process
- Transfer funds to trading account
- Consider dollar-cost averaging for long-term investment
- Research and Analysis
- Review company fundamentals
- Monitor semiconductor industry trends
- Track AI and data center market developments
- Execute Purchase
- Place order through broker platform
- Consider limit orders to control entry price
- Monitor position and rebalance as needed
Investment Opinion
Based on the provided data and forecasts, Micron (MU) shows strong potential for long-term growth, supported by:
Positive Factors
- Strong analyst consensus (Strong Buy rating)
- Expanding AI and cloud computing markets
- Leading position in memory technology
- Improving production efficiencies
- Growing demand for DRAM and NAND flash
Risk Factors
- Semiconductor industry cyclicality
- Potential supply chain disruptions
- Economic uncertainty impact
- Competition in memory market
- Technology transition risks
Investment Strategy
Consider a staged entry strategy to manage volatility:
- Initial position at current levels
- Add on market pullbacks
- Hold for 3-5 year minimum investment horizon
- Monitor quarterly earnings and industry trends
Final Thoughts
The company will experience substantial growth through 2030 because it supports AI, 5G and cloud expansion initiatives. Prospective investors can expect significant long-term return growth from their investments throughout 2030 and subsequent years despite short-term market volatility.
Disclaimer:
The provided information serves only for research purposes without holding any financial advice capacity. Before making investments you need to perform independent research.
Frequently Asked Questions (FAQs)
What does Micron Technology do?
Micron Technology Inc. operates as a semiconductor leader which offers memory and storage solutions like DRAM and NAND flash alongside SSDs for data center and consumer electronics segments and automotive applications and AI technology uses.
How has Micron’s stock performed recently?
Micron’s stock price has shown strong growth, driven by increased demand for memory chips, AI advancements, and strong earnings reports.
Is Micron a good investment?
Micron is a leading memory chip manufacturer, benefiting from rising demand in AI, cloud computing, and automotive sectors. Investors consider factors like financial performance, industry trends, and economic conditions before making investment decisions.
Does Micron pay dividends?
Yes, Micron reinstated its dividend and currently offers a quarterly dividend payout. The yield is relatively low, as the company focuses on growth and innovation.
What risks does Micron face?
Memory Chip Price Volatility (affects revenue and profitability)
Competition (Samsung, SK Hynix)
Global Economic Conditions (impacts demand for tech products)
Geopolitical Risks (U.S.-China trade tensions, export restrictions)
1 thought on “Micron Technology Inc. (MU) Stock Price Prediction and Analysis (2025–2030)”